

Algorithmic Bias in Automated Decision-Making: An Empirical Fairness Audit and Comparative Legal Analysis Across Healthcare, Labour, Criminal Justice, and Finance
Asmita Srivastava1, Asmita Singh2
1Student at Bennett University, Greater Noida, Uttar Pradesh, India
2Student at Bennett University, Greater Noida, Uttar Pradesh, India
In: Law in the Digital Decade: Rights, Regulation and Accountability, edited by Gyan Prakash Kesharwani and Ritu Verma
- Pages
- 73–87
- Published
- 2026
- Licence
- CC BY-NC 4.0
Abstract
Artificial intelligence systems increasingly mediate access to healthcare, credit, employment, and liberty, and a growing empirical literature documents substantial performance and outcome disparities across demographic groups in such systems—for instance, facial-analysis benchmarks reporting error rates as high as 34.7% for darker-skinned women against 0.8% for lighter-skinned men.
This paper combines an original empirical fairness audit with a comparative legal analysis of the principal regulatory regimes governing automated decision-making: the European Union’s Artificial Intelligence Act, the General Data Protection Regulation, and India’s Digital Personal Data Protection Act, 2023. Four datasets spanning healthcare (diabetic readmission), labour and income (ACSIncome), criminal justice (COMPAS recidivism), and finance (HMDA mortgage lending) were audited for base-rate disparities, modeled using both a glass-box logistic regression classifier and a black-box XGBoost classifier, and evaluated using demographic-parity and equalized-odds metrics. Two hypotheses were tested: that explainable-AI techniques (SHAP) improve identification of discriminatory proxy variables (supported), and that more recent training data reduces bias relative to older data (only mixed support). An empirically grounded Algorithmic Risk Matrix classifies each use case into four risk tiers, and a post-processing mitigation experiment demonstrates that identified disparities are partially, but not fully, correctable. The legal analysis situates these findings within the EU’s risk-tiered framework, the GDPR’s individual right against solely automated decision-making, and India’s largely consent-based regime, which conspicuously lacks an equivalent right. The paper argues that none of the three regimes currently operationalizes ‘high risk’ or ‘significant risk’ using quantitative fairness thresholds of the kind produced here, and that empirical audits of this type could supply the missing evidentiary bridge between statistical disparity and legal obligation.
Keywords
- Algorithmic Fairness
- AI Governance
- Automated Decision-Making
- Explainable AI
- Comparative Data-Protection Law
Full text
1 Introduction
Automated decision-making systems trained on historical data risk reproducing, and in some cases amplifying, the disparities already embedded in that data. This is now a live legal problem as much as a technical one: regulators in the European Union, and to a lesser extent in India, have begun to impose obligations on the developers and deployers of such systems, yet the statutory language used to trigger those obligations—‘high risk,’ ‘significant risk,’ ‘material effect’—is rarely defined with reference to any measurable statistical threshold. This paper attempts to close part of that gap. Part 2 situates the inquiry within the EU AI Act, the GDPR, and India’s Digital Personal Data Protection Act, 2023 (“DPDP Act”), and identifies where each regime’s language could, in principle, be operationalized using standard fairness metrics. Parts 3 through 8 report an original empirical audit of four public datasets spanning healthcare, labour, criminal justice, and finance, testing (i) whether explainable-AI tooling meaningfully aids discrimination detection, (ii) whether data recency mitigates bias, (iii) a structured, empirically grounded risk-classification framework, and (iv) whether identified disparities can be technically corrected through post-processing. Part 9 draws the technical and legal threads together, and Part 10 concludes.
2 Legal and Regulatory Framework
2.1 The EU Artificial Intelligence Act
The EU Artificial Intelligence Act2 entered into force on 1 August 2024 and adopts a risk-tiered structure: systems are classified as prohibited, high-risk, limited-risk, or minimal-risk, with obligations scaling accordingly. A system is “high-risk” if it falls within a use-case category enumerated in Annex III—including biometric identification, employment and worker management, access to essential private and public services (expressly including credit scoring and insurance risk-pricing), law enforcement, and the administration of justice3—unless the provider documents that the specific system does not pose a significant risk to health, safety, or fundamental rights. Three of this paper’s four domains—healthcare, employment/income classification, and criminal justice—map directly onto Annex III categories, and mortgage lending falls within the essential-services category through credit scoring.4 The audited domains overlap with several Annex III categories, although the legal classification depends on the particular purpose and deployment context of the AI system rather than on the sector alone. Annex III expressly covers specified uses relating to employment, access to essential private services including creditworthiness evaluation, certain law-enforcement applications, and specified healthcare-related uses.5
High-risk providers must maintain a risk-management system throughout the system’s lifecycle, ensure that training data is subject to “appropriate data governance and management practices,” and enable human oversight, but the Act does not itself specify a quantitative fairness metric or threshold that a provider must satisfy—the determination of “significant risk” and the adequacy of bias-mitigation measures are left to the provider’s own documented assessment, reviewable by national authorities.
The legal significance of the empirical audit is particularly apparent when read against Articles 9, 10, 14 and 27 of the AI Act.6 Article 9 requires providers of high-risk AI systems to establish a continuous and iterative risk-management system covering the system’s lifecycle, including the identification, estimation and mitigation of risks to health, safety and fundamental rights. Article 10 further requires appropriate data-governance and management practices for training, validation and testing datasets, while Article 14 requires effective human oversight.7 The relevance to the present audit is therefore not that demographic-parity or equalized-odds thresholds are themselves statutory thresholds, but that an empirical fairness audit can provide evidence relevant to the identification, measurement and mitigation of risks contemplated by these provisions. Article 27 strengthens this connection by requiring specified deployers of high-risk systems to conduct fundamental-rights impact assessments addressing affected groups, specific risks of harm, human oversight and remedial measures.
2.2 The General Data Protection Regulation
The GDPR8 predates the AI Act and approaches automated decision-making through an individual-rights lens rather than a systemic risk-tiering. Article 22 gives a data subject the right not to be subject to a decision based solely on automated processing, including profiling, that produces legal or similarly significant effects—language that squarely covers credit, employment, and insurance decisions of the kind audited in this study. Article 5’s fairness, accuracy, and data-minimisation principles, together with the Article 35 requirement of a data-protection impact assessment for processing likely to result in high risk, supply additional footholds, but as with the AI Act, none of these provisions specifies a statistical fairness test.9 Scholars have argued that Article 22’s disclosure and explanation obligations are difficult to operationalize without exactly the kind of feature-attribution analysis performed in Part 5 of this paper, since a data subject cannot meaningfully contest a decision without knowing which inputs drove it and whether those inputs behaved differently across protected groups.
2.3 India’s Digital Personal Data Protection Act, 2023
India’s Digital Personal Data Protection Act, 2023,10 received presidential assent on 11 August 2023 and is being brought into force in phases; the implementing Digital Personal Data Protection Rules, 2025 were notified on 13-14 November 2025, with core substantive obligations phased in through May 2027. The DPDP Act is built almost entirely around consent: a Data Fiduciary must generally obtain a Data Principal’s free, specific, informed consent before processing personal data, subject to enumerated “legitimate uses.”11 Critically, the DPDP Act contains no provision equivalent to GDPR Article 22: it does not grant an individual a freestanding right to contest a solely automated decision that produces legal or significant effects, and it imposes no risk-tiered obligations analogous to the EU AI Act’s Annex III framework. Section 12 gives Data Principals a right to correction and erasure of personal data, but that right is oriented toward data accuracy rather than the fairness of an automated inference drawn from accurate data. This means the disparities documented empirically in this paper for HMDA and ACSIncome-type use cases—both of which have direct Indian analogues in mortgage and credit-scoring and in labour-market classification—would, under the DPDP Act as currently enacted, generate no individual procedural right against the automated decision itself, even though an equivalent decision made in the EU would trigger Article 22 and, where the deployment falls within Annex III, the AI Act’s high-risk obligations.12
The absence of an express automated-decision provision in the DPDP Act does not mean that algorithmic decision-making is constitutionally unregulated in India. Depending on the actor and decision context, automated systems may implicate constitutional guarantees of equality, non-discrimination, dignity and privacy. Article 14 of the Constitution guarantees equality before the law and equal protection of the laws, while Article 15 prohibits discrimination by the State on specified grounds.13 The Supreme Court’s recognition of privacy as a constitutionally protected right in Justice K.S. Puttaswamy (Retd.) v. Union of India14 further established privacy, dignity and decisional autonomy as constitutionally protected interests under Article 21.
The constitutional framework therefore provides an important additional layer to the present comparison. The DPDP Act does not create a general right equivalent to GDPR Article 22 to contest a solely automated decision producing legal or similarly significant effects. Nevertheless, the legal consequences of algorithmic bias in India cannot be assessed exclusively through the DPDP Act, particularly where an automated system is deployed by the State or affects constitutionally protected interests. The precise legal consequences would depend upon the nature of the decision, the actor involved, the applicable statutory framework and the facts establishing the alleged infringement.
2.4 Comparative Synthesis
Read together, the three regimes sit on a spectrum from ex-ante systemic regulation (the AI Act’s risk tiers, which regulate the system regardless of any individual complaint) to ex-post individual contestation (GDPR Article 22, which is triggered only when a particular data subject invokes it) to a consent-based regime that addresses neither systemic risk nor individual contestation of automated inferences (the DPDP Act). None of the three defines “high risk,” “significant effect,” or an equivalent trigger by reference to a measurable fairness statistic such as a demographic-parity or equalized-odds difference. The empirical findings in Parts 3 through 8 are offered as a candidate for exactly that missing quantitative layer: a worked example of how likelihood, severity, and extent of harm can be derived from an auditable pipeline rather than left to qualitative judgment alone.
3 Data and Methodology
Four datasets were selected to correspond to the domains above: healthcare (Diabetic 130-US Hospitals readmission data, 1999-2008), labour/income (ACSIncome, the Folktables successor to the UCI Adult dataset, pulled for 2014 and 2022), criminal justice (COMPAS two-year recidivism data), and finance (HMDA mortgage-lending data, pulled for 2019 and 2024). ACSIncome and HMDA were each pulled for two years specifically to test the recency hypothesis (H2), since they are the only two datasets with genuine year-over-year structure; the Diabetes dataset carries only an aggregate 1999-2008 range at the dataset level rather than a per-record date, so H2 could not be tested on it.
For each dataset, the pipeline proceeded in three stages. First, a protected-attribute audit computed base-rate gaps in the target variable across protected-group categories prior to any modeling, to establish raw, data-level disparity independent of any classifier. Second, baseline models—a glass-box logistic regression model and a black-box XGBoost model—were trained on identical features with class-weighting to correct for label imbalance; an unweighted Diabetes model, for example, achieved 89% accuracy but only 1% recall on the minority readmission class, rendering any fairness metric computed on it meaningless. Third, the full Fairlearn metric suite was computed per protected group, including accuracy, false-positive/negative rates, demographic-parity difference/ratio, and equalized-odds difference/ratio.
3.1 Empirical Risk Classification Versus Legal Risk Classification
The proposed Algorithmic Risk Matrix is not intended to reproduce or replace the legal classification established by the AI Act. The AI Act uses legally defined risk categories and specified use cases, whereas the present matrix applies a quantitative research framework to empirical model outcomes. Its function is therefore evidentiary and prioritising rather than determinative: it provides a reproducible method for identifying systems that may warrant heightened legal and technical scrutiny.
This distinction is essential because the numerical thresholds used in the present study—0.20 and 0.45 for equalized-odds difference—are researcher-defined empirical thresholds and are not statutory thresholds under the AI Act. A system classified as “Critical” under this matrix does not thereby become legally “high-risk” under the AI Act. Conversely, a system may fall within a legally defined high-risk category even where a particular fairness metric appears comparatively modest. The proposed framework should therefore be understood as a supplementary evidentiary tool that can support, but cannot substitute for, the legally prescribed risk-assessment process.
The framework nevertheless corresponds conceptually with Article 9 of the AI Act, which requires the identification, estimation and mitigation of risks throughout the lifecycle of high-risk AI systems.15 It also has relevance to Article 27, which requires specified deployers to assess affected groups, specific risks and mitigation measures through a fundamental-rights impact assessment.16
Supplementary Table 1. Datasets, domains, and protected attributes examined in this study.
| Domain | Dataset | Protected attributes examined | Years |
|---|---|---|---|
| Healthcare | Diabetic 130-US Hospitals (readmission) | Race, gender, age | 1999-2008 (aggregate range only) |
| Labour / income | ACSIncome (Folktables) | Race, sex | 2014 and 2022 |
| Criminal justice | COMPAS (2-year recidivism) | Race, sex | Single cross-section |
| Finance | HMDA (mortgage lending) | Race, sex, ethnicity | 2019 and 2024 |
Note: the Diabetic 130-US Hospitals dataset carries no per-record date or year field, only an aggregate 1999-2008 range at the dataset level, so the recency hypothesis (H2, Part 6) could not be tested on it with a genuine temporal split; only ACSIncome and HMDA provide real recency tests.
4 Empirical Findings: Base-Rate and Model-Level Disparities
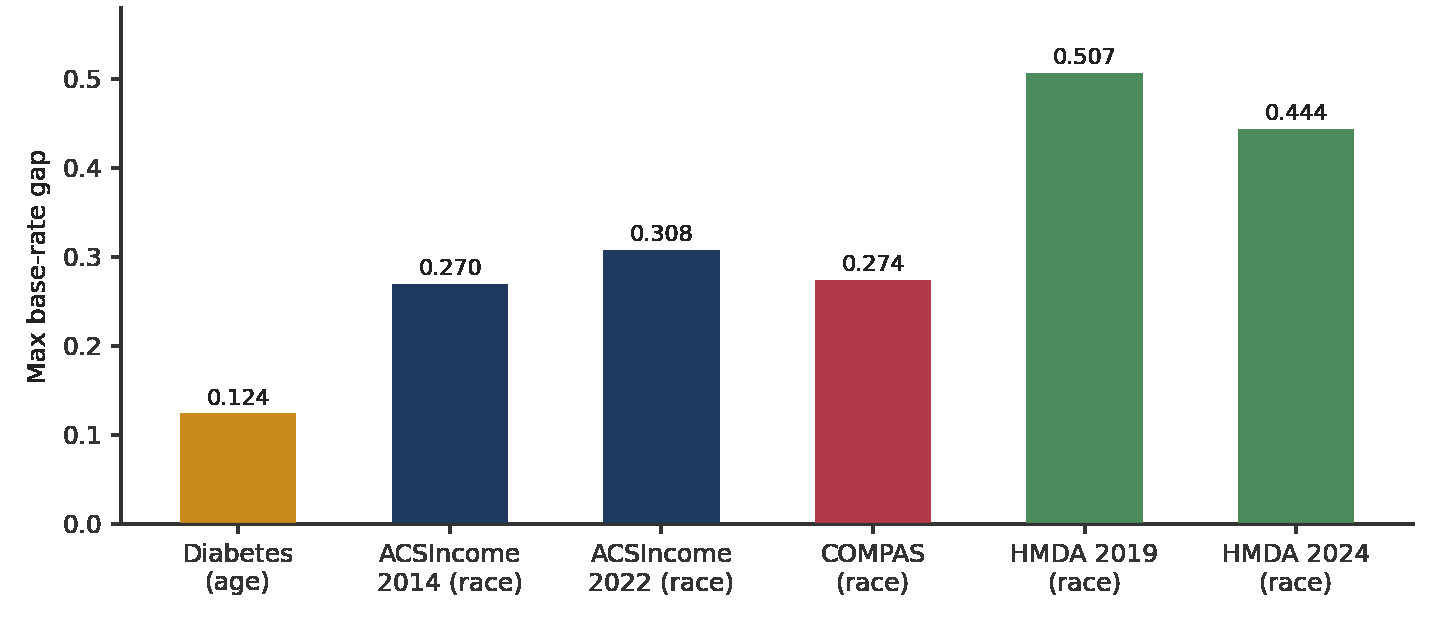
Base-rate gaps in the raw data, prior to any modeling, were substantial across every domain and were consistently largest along the race axis except in the Diabetes dataset, where age dominated. HMDA’s racial gap in loan-approval rate was 50.7 percentage points in 2019, narrowing to 44.4 points in 2024. COMPAS’s racial gap in two-year recidivism (27.4 points between the highest and lowest race categories; 51.4% for Black defendants versus 39.4% for White defendants) closely matches the widely cited investigative findings that first brought the tool’s racial disparities to public attention, which serves here as a validation of the audit pipeline before it is applied to the newer datasets.
4.1 Legal Significance of the Base-Rate Disparities
The presence of a statistical disparity does not, by itself, establish unlawful discrimination. Its legal significance depends upon the governing jurisdiction, the protected characteristic, the decision context and the relationship between the challenged practice and the observed disparity. Statistical disparity can nevertheless constitute important evidence in discrimination analysis. In Griggs v. Duke Power Co.18, the U.S. Supreme Court held that a facially neutral employment practice may violate Title VII where it disproportionately excludes a protected group and cannot be justified by business necessity. Title VII subsequently codified the disparate-impact framework, including the employer’s burden to demonstrate that a challenged practice is job related and consistent with business necessity once the statutory conditions are met.19 Accordingly, the disparities observed in Figure 1 should be treated as potential evidentiary signals rather than findings of legal liability. The purpose of the base-rate analysis is to establish whether unequal outcomes exist before model training; determining whether those disparities are legally attributable to discriminatory criteria, historical inequality, legitimate predictive factors or other causes requires a separate legal and causal inquiry.
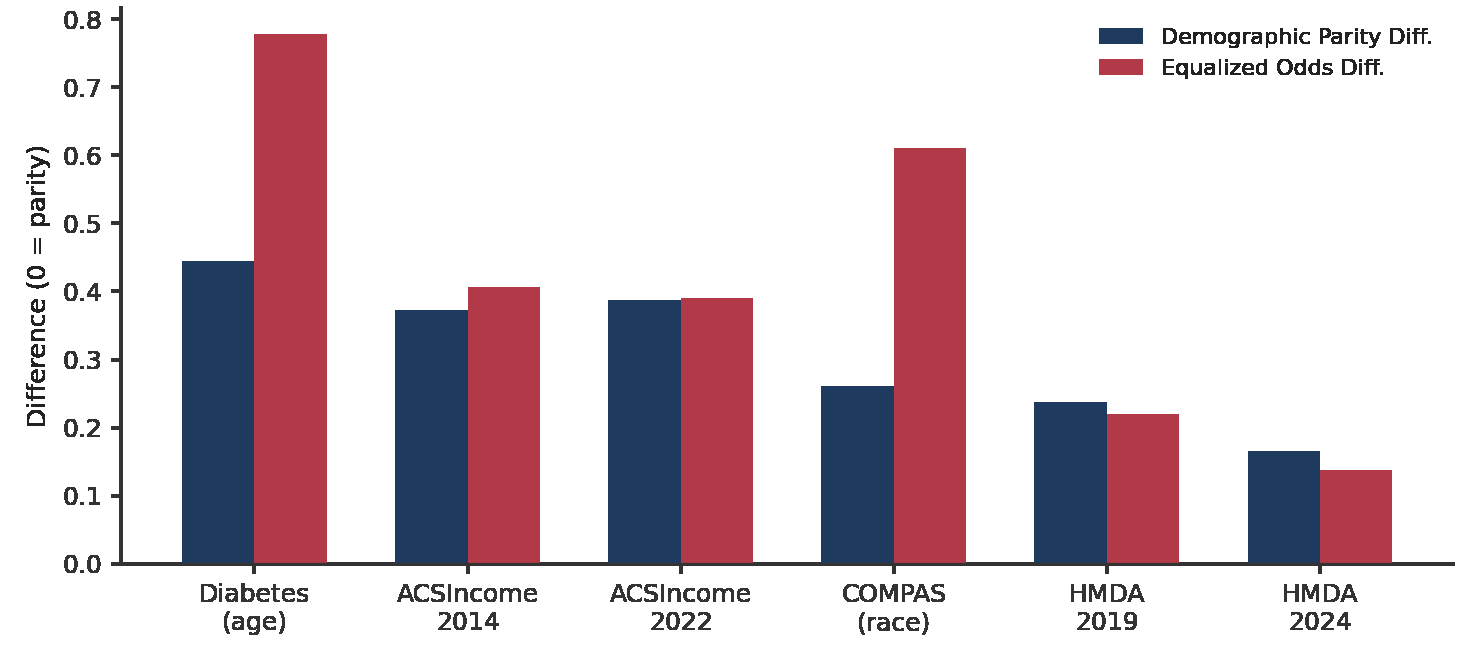
At the model level, XGBoost achieved accuracy ranging from 0.665 (Diabetes) to 0.831 (HMDA 2019), broadly consistent with published benchmarks for these datasets. Demographic-parity and equalized-odds differences on each dataset’s dominant protected attribute (race, except age for Diabetes) ranged from 0.14 (HMDA 2024) to 0.78 equalized-odds difference (Diabetes, age), with COMPAS showing the largest equalized-odds gap on race (0.611) of any dataset. Race produced consistently larger demographic-parity differences (0.17-0.39) than sex or ethnicity (0.01-0.16) across every dataset, and the Diabetes dataset’s largest disparity ran along age rather than race or sex—a finding of independent legal significance, since age discrimination is generally treated as a distinct doctrinal category from race or sex discrimination.
4.2 Legal Significance of Demographic-Parity and Equalized-Odds Differences
The fairness metrics used in this study should not be treated as independent legal tests of discrimination. Demographic parity measures differences in selection or prediction rates between groups, while equalized odds examines whether relevant error rates are distributed similarly across groups. Neither metric is expressly established as a dispositive legal threshold by the AI Act, the GDPR or the DPDP Act. Their legal value is therefore evidentiary rather than determinative.
A substantial equalized-odds difference may demonstrate that an automated system performs differently across protected groups and may justify further examination of its training data, features, proxy variables, decision thresholds and potential harms. It does not, however, establish that the system has committed unlawful discrimination. Statistical disparity may result from differences in base rates, feature distributions, model design or other structural conditions. The legal inquiry must therefore proceed from statistical evidence to the applicable jurisdiction-specific test.
This distinction is consistent with disparate-impact doctrine in U.S. discrimination law, where statistical disparities may form an important part of the evidentiary showing but do not independently resolve the legal question. See Watson v. Fort Worth Bank & Trust20. The results in Figure 2 should therefore be understood as identifying systems and protected groups requiring closer legal and technical scrutiny, rather than as automatically classifying any model as unlawful.
Supplementary Table 2. XGBoost baseline performance across datasets.
| Dataset | Model | Accuracy | AUC | Note |
|---|---|---|---|---|
| Diabetes | XGBoost | 0.665 | 0.682 | Class-imbalance corrected |
| ACSIncome 2014 | XGBoost | 0.807 | 0.899 | Balanced classes |
| ACSIncome 2022 | XGBoost | 0.804 | 0.890 | Balanced classes |
| COMPAS | XGBoost | 0.672 | 0.715 | Matches published literature range |
| HMDA 2019 | XGBoost | 0.831 | 0.838 | Stratified 150k sample |
| HMDA 2024 | XGBoost | 0.823 | 0.861 | Stratified 150k sample |
The full fairness-metric results underlying Figure 2—accuracy, demographic-parity difference/ratio, and equalized-odds difference/ratio for both the logistic-regression and XGBoost models, across every protected attribute in every dataset—are reported in Appendix A.
5 Explainability and the Discriminatory-Proxy Problem (H1)
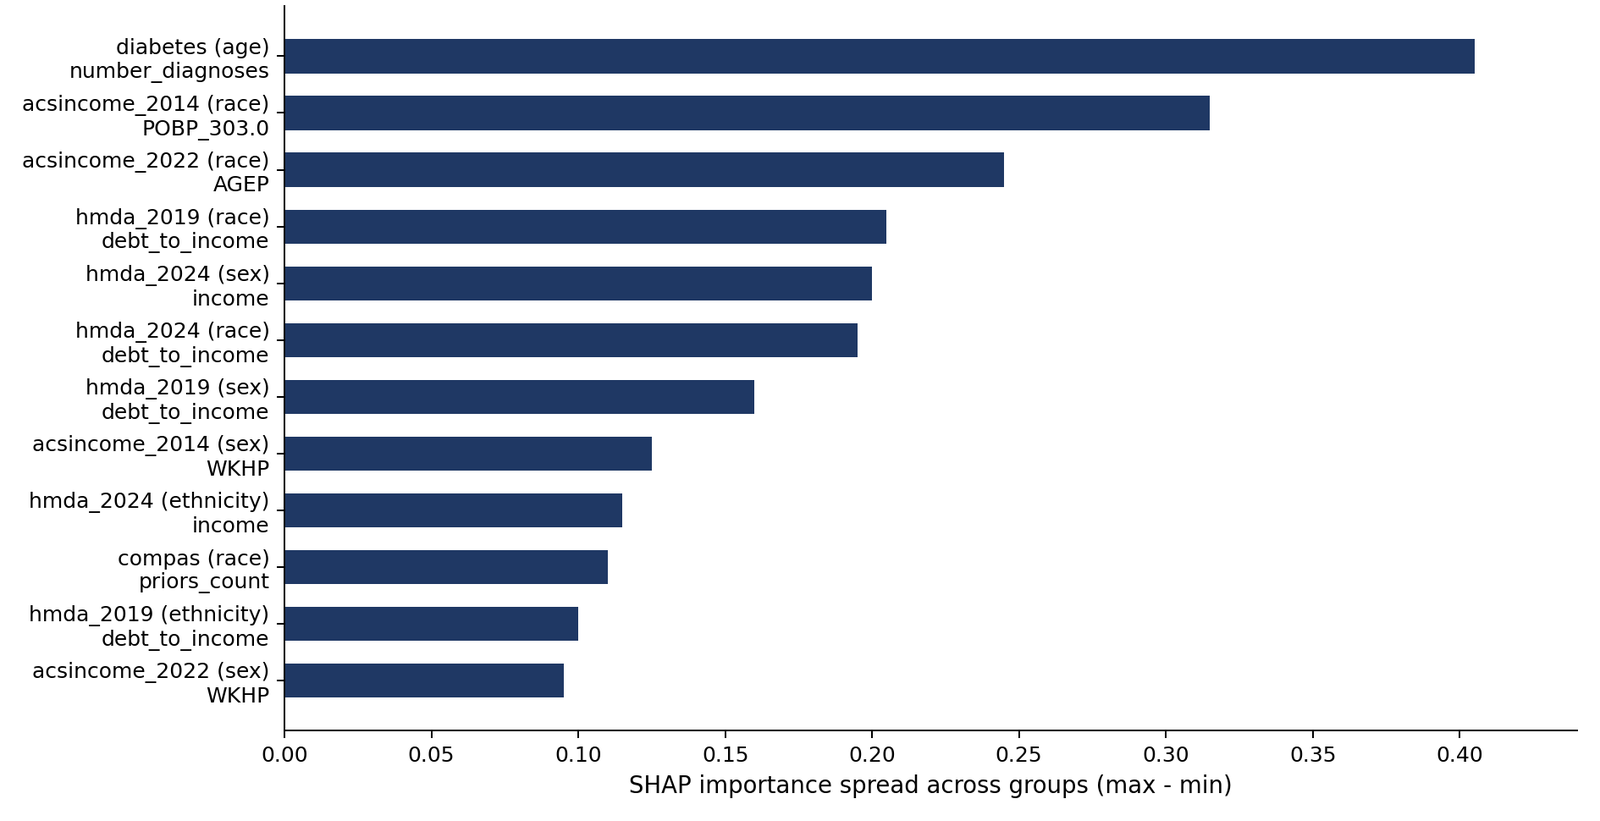
For each dataset’s XGBoost model, SHAP21 (SHapley Additive exPlanations) was used to compute per-feature contribution to each prediction, measuring both global feature importance and the divergence of a feature’s importance across protected-group categories—the latter being the signature of a feature functioning as a proxy for a protected characteristic even where the protected characteristic itself is excluded from the model.
The results support H1. In ACSIncome, place of birth was the single strongest race-divergent feature in 2014 (age in 2022), a textbook proxy variable since place of birth correlates with race and national origin; hours worked per week diverged most by sex, plausibly reflecting labour-market structure rather than an algorithmic artifact. In COMPAS, prior-arrest count and age dominated both global importance and racial divergence, consistent with longstanding critiques that criminal-history features themselves encode racially disparate policing and arrest patterns, allowing a model to exclude race directly while still reproducing racial disparity through its inputs. In HMDA, debt-to-income ratio was by far the dominant feature globally and the most group-divergent feature across race, sex, and ethnicity in 2019 and by race in 2024 (income diverged most by sex and ethnicity in 2024), indicating a major channel for disparate mortgage outcomes.
SHAP divergence establishes only that a feature’s influence differs by group; it does not by itself establish that the feature is an illegitimate discriminatory proxy rather than a feature that is legitimately predictive and happens to correlate with a protected group for independent structural reasons. Resolving that distinction is a legal and causal judgment that lies at the core of disparate-impact doctrine22 and of Article 22 GDPR’s explanation requirement, which scholars have argued cannot be satisfied without feature-attribution methods of exactly this kind.23
The legal significance of the SHAP results lies in their ability to identify features that may reproduce disparities even when a protected characteristic is excluded explicitly from the model. Place of birth, geographic variables, criminal-history variables and financial variables may correlate with protected characteristics and thereby contribute to unequal outcomes. Such correlation does not itself establish unlawful discrimination because a feature may be legitimately predictive while also correlating with a protected characteristic. The relevant legal inquiry is whether the feature produces a legally cognizable discriminatory effect, whether its use has a legitimate justification where required by the applicable law, and whether less discriminatory alternatives are available.
The distinction is particularly relevant to the disparate-impact framework recognized in U.S. employment discrimination law. See Griggs v. Duke Power Co.24 It also has relevance under the AI Act’s data-governance and risk-management framework, which requires attention to the quality and governance of datasets and to risks to fundamental rights. SHAP divergence should therefore be understood as a screening mechanism that identifies features requiring legal and causal investigation, rather than as proof that a feature constitutes an unlawful proxy.
6 Recency and Bias (H2)
H2 was tested on the only two datasets with genuine year-over-year structure. In ACSIncome, the race-based demographic-parity difference increased with recency (0.373 to 0.388) while the sex-based disparity decreased (0.082 to 0.062). In HMDA, the race-based difference decreased substantially with recency (0.237 to 0.165) while the sex-based disparity increased slightly (0.057 to 0.108). Recency’s effect on bias therefore appears to be domain- and attribute-dependent rather than a uniform mitigant, a more defensible conclusion than a blanket claim that newer data is fairer data, and one with direct policy relevance to any regime—such as the AI Act’s data-governance obligations—that treats data currency as a proxy for data quality.
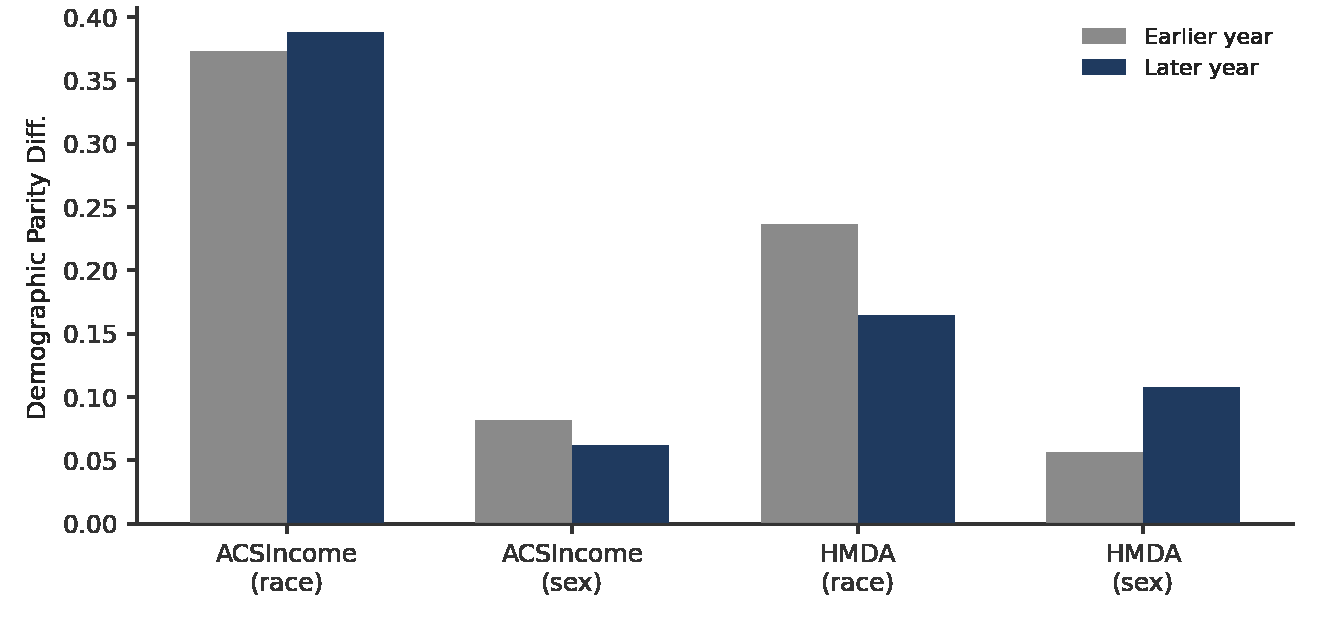
The mixed effect of data recency has an important legal implication. Newer data cannot automatically be treated as more representative, accurate or less discriminatory. Article 10 of the AI Act adopts a broader data-governance approach by requiring attention to data quality, relevance, representativeness, preparation, labelling, updating and suitability for the intended purpose.25 The results in Figure 4 support this approach empirically: racial disparity decreased in HMDA while increasing in ACSIncome despite both datasets being updated to a later period. Temporal recency therefore appears to be an inadequate proxy for fairness. For regulatory purposes, the quality and representativeness of data should be assessed substantively rather than inferred merely from the date on which the data were collected.
7 The Algorithmic Risk Matrix and Its Legal Grounding
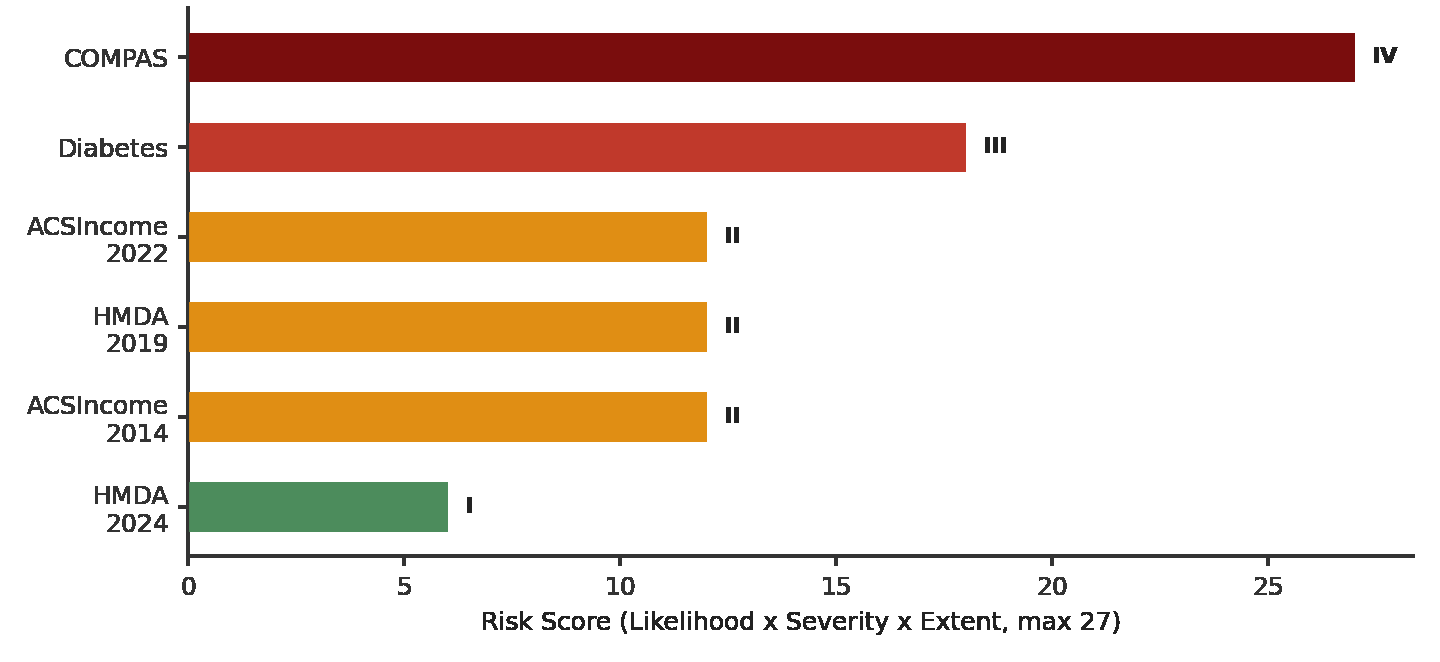
Each use case was scored on three factors—Likelihood, Severity, and Extent of harm, each on a 1-3 scale—multiplied into a risk score (maximum 27) and mapped to four risk levels (I Low to IV Critical). Likelihood was derived empirically as the worst-case equalized-odds difference found for that dataset’s XGBoost model (below 0.20 = Low, 0.20-0.45 = Medium, at or above 0.45 = High). Severity and Extent are necessarily domain-level judgment calls rather than purely data-derived quantities; here they were informed by the AI Act’s Annex III high-risk classifications discussed in Part 2.1, offered as a defensible starting point for legal or policy review rather than a final determination.
Table 1. Algorithmic Risk Matrix by dataset/use case. Score = Likelihood × Severity × Extent (max 27).
| Dataset | Domain | Max EO Diff | Score | Risk Level |
|---|---|---|---|---|
| COMPAS | Criminal justice | 0.611 | 27 | IV — Critical |
| Diabetes | Healthcare | 0.778 | 18 | III — High |
| ACSIncome 2022 | Labour/income | 0.390 | 12 | II — Limited |
| ACSIncome 2014 | Labour/income | 0.407 | 12 | II — Limited |
| HMDA 2019 | Finance | 0.220 | 12 | II — Limited |
| HMDA 2024 | Finance | 0.138 | 6 | I — Low |
The resulting ordering—COMPAS (Critical), Diabetes (High), ACSIncome and HMDA 2019 (Limited), HMDA 2024 (Low)—tracks the AI Act’s own severity hierarchy reasonably well: criminal-justice risk-assessment and healthcare-access systems sit within Annex III categories that the Act itself treats as most severe, while mortgage lending, though nationally significant in extent, involves reversible economic rather than liberty or health harm. Notably, HMDA moves from Risk Level II in 2019 to Level I in 2024, a concrete link back to the H2 finding that recency reduced HMDA’s race-based disparity, illustrating how the empirical results and the risk-classification framework are directly connected and, in principle, could be re-run periodically to support a provider’s ongoing Annex III risk documentation obligation.
8 Mitigation Experiment and the Limits of Technical Correction
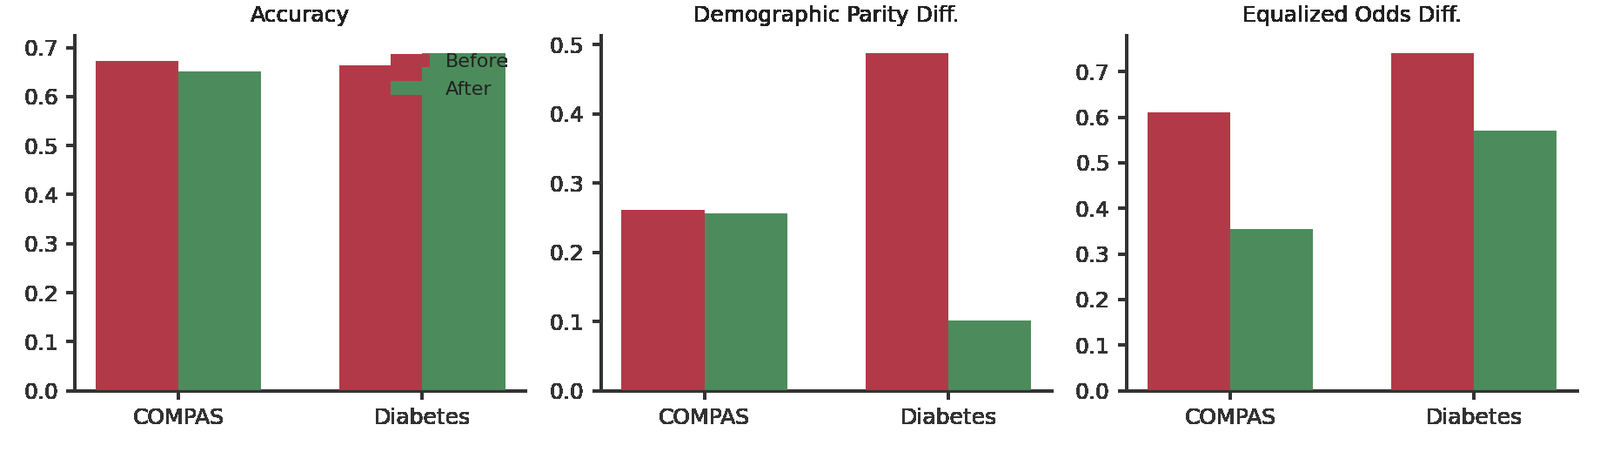
The two highest-risk use cases—COMPAS (Level IV) and Diabetes (Level III)—were subjected to a post-processing mitigation experiment using Fairlearn’s ThresholdOptimizer, which learns separate decision thresholds per protected group so that false-positive and false-negative rates are equalized across groups.26 For COMPAS, equalized-odds difference fell 42% (0.611 to 0.354) at a cost of 2.2 accuracy points and a modest recall drop, while demographic parity barely moved (0.261 to 0.256)—an illustration of Kleinberg et al.’s finding that distinct fairness criteria are not generally improved together by the same intervention.
For Diabetes, an initial mitigation attempt produced an apparently spectacular result—accuracy rising from 66% to 89% and the equalized-odds gap collapsing from 0.74 to 0.02—that on inspection proved to be a false positive: the “corrected” model was simply predicting no-readmission for 99.7% of cases against an actual readmission rate of 11%, satisfying equalized odds only because it was equally useless for every age group. Switching the optimizer’s objective from accuracy to balanced accuracy corrected this “fairness through triviality” failure mode; the corrected run reduced the equalized-odds gap by 23% (0.741 to 0.571) and demographic parity by 79% (0.488 to 0.102), with recall falling only modestly (0.587 to 0.478). The episode is itself a legally relevant finding: it demonstrates why any compliance claim of bias having been “fixed”—whether under the AI Act’s risk-management obligations or a voluntary fairness audit—should be accompanied by recall and utility figures subject to independent verification, since a fairness-metric improvement reported in isolation can conceal a degenerate, non-functional model.
8.1 Legal Significance of the Mitigation Results
The mitigation experiment demonstrates why legal compliance cannot be reduced to optimisation of a single fairness metric. A post-processing intervention may reduce equalized-odds disparity while simultaneously reducing recall or other measures of predictive utility. This is particularly important in high-impact domains, where the costs of false-positive and false-negative outcomes may themselves affect legally protected interests. The AI Act’s risk-management framework similarly requires risks to be identified and mitigated rather than merely producing compliance with one numerical fairness measure.27 The Diabetes result is especially significant because the initial apparent fairness improvement resulted from a model that predicted the negative outcome for almost all observations. The finding demonstrates that an isolated improvement in a fairness metric cannot establish that an AI system has been meaningfully corrected. A legally relevant audit should therefore report fairness measures together with accuracy, recall, error rates and other context-specific measures of system utility. This supports a multidimensional conception of algorithmic accountability in which mitigation must reduce discriminatory risk without rendering the system substantively non-functional.
Supplementary Table 3. Mitigation results. Recall on the positive class is reported alongside the fairness metrics to guard against the ‘fairness through triviality’ failure mode described above. The Diabetes before-mitigation figures come from the mitigation run and differ from the baseline figures in Table 1 and Appendix Table A1.
| Dataset | Stage | Accuracy | Recall (pos. class) | DP Diff | EO Diff |
|---|---|---|---|---|---|
| COMPAS | Before mitigation | 0.672 | 0.625 | 0.261 | 0.611 |
| COMPAS | After mitigation | 0.651 | 0.569 | 0.256 | 0.354 |
| Diabetes | Before mitigation | 0.664 | 0.587 | 0.488 | 0.741 |
| Diabetes | After mitigation | 0.689 | 0.478 | 0.102 | 0.571 |
9 Discussion: Bridging the Technical and Legal Findings
Three points of synthesis follow. First, the persistent dominance of race as the largest disparity axis across every domain except Diabetes (where age dominates) supports treating race-based algorithmic disparity as the AI Act’s Annex III framework implicitly does: as a first-order systemic risk warranting close regulatory attention regardless of sector, while cautioning that a single dominant-axis metric can obscure real disparities in other protected characteristics that a narrower audit would miss. Second, the SHAP findings in Part 5 give concrete content to the disparate-impact proxy-discrimination inquiry that both EU and Indian discrimination law recognize in principle but rarely operationalize empirically; a regulator applying the AI Act’s data-governance requirements could, in principle, require exactly this kind of divergence analysis as evidence of “appropriate” bias examination. Third, and most directly a legal gap, is the DPDP Act’s absence of any provision equivalent to GDPR Article 22: an Indian mortgage applicant or job-seeker subject to a model exhibiting the disparities documented here for HMDA- and ACSIncome-type use cases has, under current Indian law, no individual procedural right against the automated decision itself, even though the underlying statistical disparity is of the same order of magnitude as that documented for the EU-regulated equivalents. This asymmetry is not merely theoretical: India’s technology and financial-services sectors deploy automated credit and employment screening at a scale comparable to the jurisdictions this paper’s data was drawn from, and the absence of an operative automated-decision right leaves a comparable population without a comparable remedy.
The paper’s central methodological limitation is one shared by any audit of this kind: SHAP divergence, base-rate gaps, and post-processing mitigation results are correlational and cannot, standing alone, establish that a given disparity is unlawful discrimination rather than a legitimately predictive, structurally correlated feature. Severity and Extent scores in the Risk Matrix remain domain-level judgment calls rather than validated legal categories. These limitations argue for treating the empirical pipeline presented here as a candidate evidentiary tool for regulators and litigants—one that could inform where the AI Act’s “significant risk” documentation burden should fall most heavily, or what a GDPR Article 22 explanation should contain—rather than as a self-executing legal determination.
10 Conclusion
This paper finds substantial, measurable disparities across healthcare, labour, criminal justice, and finance, with race the dominant axis of disparity in three of the four domains examined. Explainability tooling meaningfully surfaces dataset-specific proxy variables invisible to aggregate fairness metrics alone, though it cannot resolve whether a given proxy is unlawful in a legal sense. Data recency shows a genuinely mixed effect, cutting against a blanket regulatory preference for newer training data. Identified disparities are only partially correctable through standard fairness-aware post-processing, with a documented failure mode—fairness improvements achieved through a degenerate, functionally useless model—that any legal compliance regime relying on fairness metrics must guard against. None of the three regulatory regimes examined operationalizes its central trigger for obligation using a quantitative fairness threshold; the empirically derived Risk Matrix developed here is offered as one template for what that missing quantitative layer could look like, and as a demonstration that the gap between an EU data subject’s Article 22 rights and an Indian data principal’s current lack of an equivalent right is not merely doctrinal, but corresponds to comparable underlying statistical disparities documented across this paper’s four domains.
Data and Code Availability
All four datasets analyzed in this study are publicly available from their original sources. The Diabetic 130-US Hospitals readmission dataset is available from the UCI Machine Learning Repository (archive.ics.uci.edu, dataset ID 296). ACSIncome is available through the Folktables package (github.com/socialfoundations/folktables), which derives it from the U.S. Census Bureau’s American Community Survey Public Use Microdata Sample. The COMPAS two-year recidivism dataset is available from ProPublica’s compas-analysis repository (github.com/propublica/compas-analysis). The HMDA mortgage-lending data is available from the Consumer Financial Protection Bureau’s HMDA Platform (ffiec.cfpb.gov/data-browser). The analysis code implementing the audit pipeline described in Part 3 — data preprocessing, the glass-box and black-box classifiers, the Fairlearn fairness-metric computations, the SHAP explainability analysis, the Algorithmic Risk Matrix scoring, and the ThresholdOptimizer mitigation experiment — is available from the authors upon reasonable request.
Appendix A. Full Fairness-Metric Results
Full fairness-metric results across all datasets, models (glass-box logistic regression and black-box XGBoost), and protected attributes, underlying Figure 2 in Part 4. DP = Demographic Parity; EO = Equalized Odds. Ratio metrics closer to 1.0 indicate more parity; difference metrics closer to 0.0 indicate more parity.
Appendix Table A1. Full fairness-metric results across all datasets, models, and protected attributes.
| Dataset | Model | Attribute | Acc. | DP Diff | DP Ratio | EO Diff | EO Ratio |
|---|---|---|---|---|---|---|---|
| ACSIncome 2014 | LogReg | race | 0.812 | 0.344 | 0.306 | 0.396 | 0.000 |
| ACSIncome 2014 | LogReg | sex | 0.812 | 0.081 | 0.825 | 0.015 | 0.928 |
| ACSIncome 2014 | XGBoost | race | 0.807 | 0.373 | 0.300 | 0.407 | 0.287 |
| ACSIncome 2014 | XGBoost | sex | 0.807 | 0.082 | 0.827 | 0.016 | 0.929 |
| ACSIncome 2022 | LogReg | race | 0.807 | 0.382 | 0.383 | 0.372 | 0.000 |
| ACSIncome 2022 | LogReg | sex | 0.807 | 0.061 | 0.884 | 0.006 | 0.989 |
| ACSIncome 2022 | XGBoost | race | 0.804 | 0.388 | 0.384 | 0.390 | 0.000 |
| ACSIncome 2022 | XGBoost | sex | 0.804 | 0.062 | 0.884 | 0.005 | 0.980 |
| COMPAS | LogReg | race | 0.668 | 0.292 | 0.520 | 0.527 | 0.000 |
| COMPAS | LogReg | sex | 0.668 | 0.137 | 0.727 | 0.103 | 0.722 |
| COMPAS | XGBoost | race | 0.672 | 0.261 | 0.533 | 0.611 | 0.000 |
| COMPAS | XGBoost | sex | 0.672 | 0.158 | 0.665 | 0.127 | 0.601 |
| Diabetes | LogReg | age | 0.659 | 0.448 | 0.000 | 0.759 | 0.000 |
| Diabetes | LogReg | gender | 0.659 | 0.013 | 0.964 | 0.048 | 0.915 |
| Diabetes | LogReg | race | 0.659 | 0.229 | 0.365 | 0.408 | 0.274 |
| Diabetes | XGBoost | age | 0.665 | 0.445 | 0.000 | 0.778 | 0.000 |
| Diabetes | XGBoost | gender | 0.665 | 0.021 | 0.943 | 0.047 | 0.923 |
| Diabetes | XGBoost | race | 0.665 | 0.185 | 0.490 | 0.285 | 0.495 |
| HMDA 2019 | LogReg | ethnicity | 0.713 | 0.112 | 0.838 | 0.088 | 0.811 |
| HMDA 2019 | LogReg | race | 0.713 | 0.197 | 0.721 | 0.143 | 0.652 |
| HMDA 2019 | LogReg | sex | 0.713 | 0.082 | 0.881 | 0.079 | 0.797 |
| HMDA 2019 | XGBoost | ethnicity | 0.831 | 0.071 | 0.909 | 0.085 | 0.774 |
| HMDA 2019 | XGBoost | race | 0.831 | 0.237 | 0.703 | 0.220 | 0.393 |
| HMDA 2019 | XGBoost | sex | 0.831 | 0.057 | 0.927 | 0.078 | 0.788 |
| HMDA 2024 | LogReg | ethnicity | 0.627 | 0.059 | 0.898 | 0.106 | 0.731 |
| HMDA 2024 | LogReg | race | 0.627 | 0.297 | 0.515 | 0.304 | 0.494 |
| HMDA 2024 | LogReg | sex | 0.627 | 0.122 | 0.795 | 0.147 | 0.654 |
| HMDA 2024 | XGBoost | ethnicity | 0.823 | 0.106 | 0.861 | 0.059 | 0.816 |
| HMDA 2024 | XGBoost | race | 0.823 | 0.165 | 0.792 | 0.138 | 0.666 |
| HMDA 2024 | XGBoost | sex | 0.823 | 0.108 | 0.861 | 0.055 | 0.835 |
Notes
Joy Buolamwini & Timnit Gebru, Gender Shades: Intersectional Accuracy Disparities in Commercial Gender Classification, 81 Proc. Machine Learning Rsch. 1, 1–15 (2018). ↩
Regulation (EU) 2024/1689 of the European Parliament and of the Council of 13 June 2024 Laying Down Harmonised Rules on Artificial Intelligence, 2024 O.J. (L 1689) [hereinafter AI Act]. ↩
Regulation (EU) 2024/1689, art. 6(2) & annex III. ↩
Id. ↩
Id. annex III. ↩
Id. arts. 6, 9–10, 14, 27. ↩
Id. arts. 9–10, 14, 27. ↩
Regulation (EU) 2016/679 of the European Parliament and of the Council of 27 April 2016 on the Protection of Natural Persons with Regard to the Processing of Personal Data (General Data Protection Regulation), 2016 O.J. (L 119) 1. ↩
Id. arts. 5, 22, 35. ↩
Digital Personal Data Protection Act, 2023 [hereinafter DPDP Act]. ↩
DPDP Rules, 2025, Gazette of India, pt. II sec. 3(i) (Nov. 14, 2025); Digital Personal Data Protection Act, 2023, §§ 4–7. ↩
See Digital Personal Data Protection Act, 2023 (containing no automated-decision-making provision analogous to GDPR art. 22). ↩
India Const. arts. 14–15. ↩
Justice K.S. Puttaswamy (Retd.) v. Union of India, (2017) 10 SCC 1. ↩
Regulation (EU) 2024/1689, art. 9, 2024 O.J. (L 1689) 1. ↩
Id. art. 27. ↩
Julia Angwin et al., Machine Bias, ProPublica (May 23, 2016), https://www.propublica.org/article/machine-bias-risk-assessments-in-criminal-sentencing. ↩
Griggs v. Duke Power Co., 401 U.S. 424, 430–32 (1971). ↩
42 U.S.C. § 2000e-2(k)(1)(A). ↩
Watson v. Fort Worth Bank & Trust, 487 U.S. 977, 994–95 (1988). ↩
Scott M. Lundberg & Su-In Lee, A Unified Approach to Interpreting Model Predictions, 31 Adv. Neural Info. Processing Sys. 4765 (2017). ↩
See Solon Barocas & Andrew D. Selbst, Big Data’s Disparate Impact, 104 Calif. L. Rev. 671, 680–93 (2016) (analyzing how facially neutral variables can operate as proxies for protected classes). ↩
Sandra Wachter, Brent Mittelstadt & Chris Russell, Counterfactual Explanations Without Opening the Black Box: Automated Decisions and the GDPR, 31 Harv. J.L. & Tech. 841, 843–45 (2018). ↩
Griggs, 401 U.S. at 430–32. ↩
Regulation (EU) 2024/1689, art. 10, 2024 O.J. (L 1689) 1. ↩
On the trade-offs inherent in any such fairness-constrained optimization, see Jon Kleinberg, Sendhil Mullainathan & Manish Raghavan, Inherent Trade-Offs in the Fair Determination of Risk Scores, 8th Innovations in Theoretical Comput. Sci. Conf. 43:1 (2017) (proving that demographic parity and equalized-odds-type criteria generally cannot be simultaneously satisfied except in degenerate cases). ↩
Regulation (EU) 2024/1689, art. 9, 2024 O.J. (L 1689) 1. ↩
Cite this chapter
Rights and permissions
Open accessThis chapter is published under the Creative Commons Attribution-NonCommercial 4.0 International licence, which permits use and sharing with appropriate credit to the authors and the source, within the terms of that licence.